San Diego Life Sciences
Lab / Office Market Report
Core Cluster market conditions, capital activity and tenant strategy. Stronger signed leasing and lower marketed availability support stabilization, while negative Q3 net absorption leaves a sustained recovery unconfirmed.
Stabilization with mixed signals: signings rise, net absorption turns negative
Stronger signed leasing and lower marketed availability support stabilization, while negative Q3 net absorption leaves a sustained recovery unconfirmed.
Key conclusions
1. Net absorption has not confirmed a sustained turn.
Q2's positive net absorption did not repeat. Vacancy rose from a restated 27.1% to 28.1%, and year-to-date net absorption fell to (197,224) SF. Sorrento Valley and UTC gained reported occupied space, while Sorrento Mesa and Torrey Pines lost it. Sustained occupancy growth remains unconfirmed.
2. Signed leases are a strong forward occupancy indicator.
Of the 437,771 SF signed in Q3, 95.6% carries recorded move dates after September. Lower marketed availability adds a constructive signal. The net absorption benefit will depend on when tenants occupy space, whether they expand or relocate, and how much space they release elsewhere in the Core.
3. Tenant choice remains substantial.
Capital and company activity cover the broader San Diego County life-science ecosystem; real-estate fundamentals cover the four-submarket Voit Core Cluster. County venture funding declined to $391.55M across 16 companies. Two IPOs raised a combined $614.55M in gross proceeds, reported separately from venture funding. Within the Core, no Q3 deliveries and one building under construction limit new supply pressure, while substantial existing availability preserves tenant choice.
Compare direct-lease and sublease spaces that meet your technical requirements and delivery schedule. Evaluate actual landlord and sublandlord offers for currently available comparable spaces, including total occupancy cost, buildout obligations and expansion or exit provisions. Base the lease decision on the terms and flexibility your operating plan requires. Q3 does not establish an imminent change in concessions.
High vacancy, with sharply different local conditions
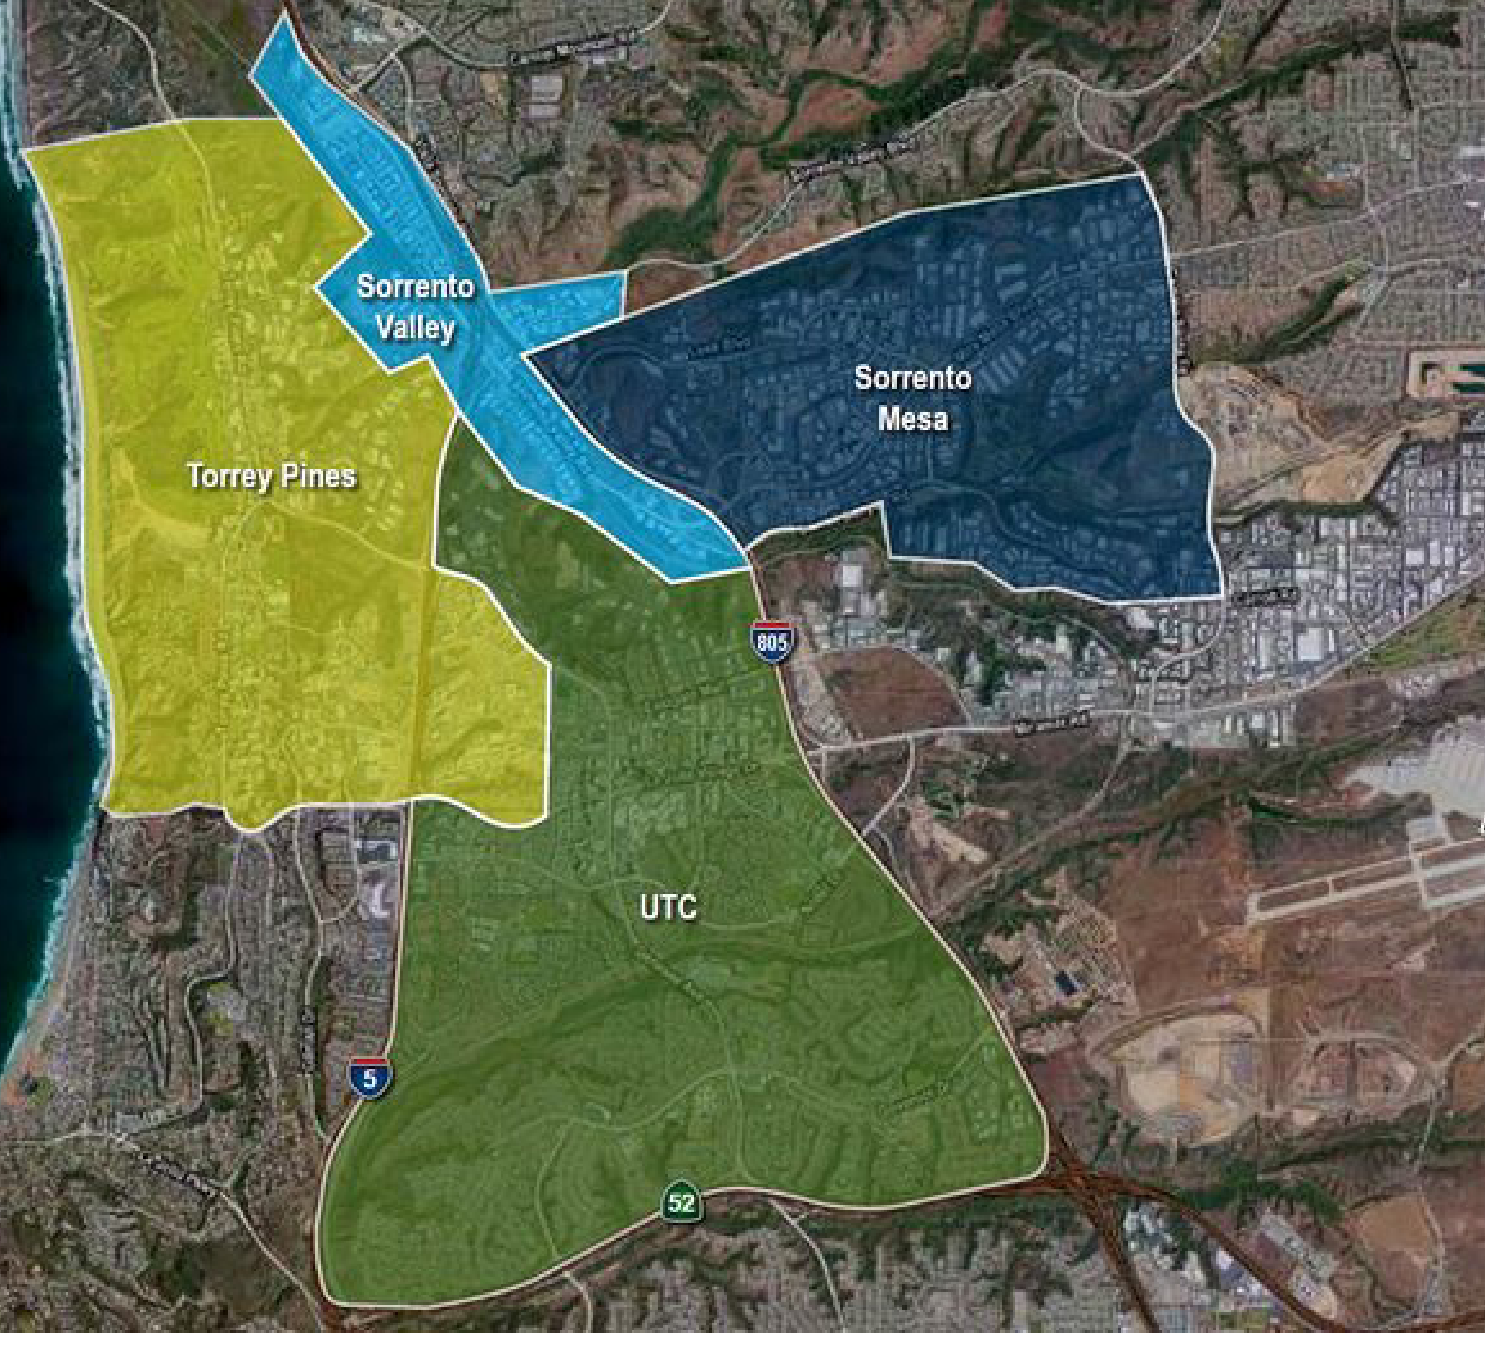
Across 338 buildings and 20.53M SF, Torrey Pines remains the tightest submarket while Sorrento Mesa carries the greatest vacancy.
The difference between Sorrento Mesa and Torrey Pines vacancy is approximately 28.7 percentage points.
Available lab space: direct and sublease
Direct availability fell 182,657 SF quarter over quarter, driven primarily by Torrey Pines and UTC. Sublease availability fell 47,338 SF, with Sorrento Valley accounting for the decline.
Submarket overview · Q3 2026
| Submarket | Inventory SF | Q3 net absorption SF | Total vacancy | Calculated availability¹ |
|---|---|---|---|---|
| Sorrento Mesa | 8,507,833 | (283,519) | 41.4% | 44.9% |
| Sorrento Valley | 1,821,234 | +72,124 | 31.6% | 34.9% |
| Torrey Pines | 6,204,328 | (29,670) | 12.7% | 20.0% |
| UTC | 3,995,465 | +25,686 | 22.3% | 15.8% |
| Core Cluster | 20,528,860 | (215,379) | 28.1% | 30.5% |
Vacancy remains elevated
Reported vacancy rose to 28.1% in Q3 and has ranged from 27.1% to 28.1% over the past six quarters. Inventory changed during that period, so the narrow range alone does not establish a market bottom.
Fundamentals
| Metric | Q3 2026 |
|---|---|
| Class A average direct asking rent | $5.75/SF/month² |
| Total vacant space | 5,777,093 SF |
| Q3 / YTD net absorption | (215,379) / (197,224) SF |
| Q3 / YTD completions | 0 / 0 SF |
| Under construction | 466,592 SF |
¹ Submarket availability rates divide available SF by existing inventory plus under-construction SF. This calculation reproduces CoStar's reported Core availability rate of 30.5% at the displayed precision; it is not a documented CoStar field definition. Vacancy rates use existing inventory.
² The $5.75 Class A asking rent is a current Q3 measure. No prior-quarter comparison on the same reporting basis is presented. The rent service basis has not been verified.
Rent methodology: Asking rents are withheld for a substantial share of Core Cluster lab properties. Because disclosed asking rents may not represent the broader market, this report does not use published asking-rent averages as a market-wide historical trend measure.
Q3 net absorption turned negative as signed leasing strengthened
Sorrento Mesa's reported loss exceeded the Core's net decline, while stronger signings and lower marketed availability improved the forward indicators.
Submarket divergence
| Submarket | Reported Q3 condition |
|---|---|
| Sorrento Mesa | Largest absorption loss; 41.4% vacancy |
| Sorrento Valley | Strongest occupancy gain |
| Torrey Pines | Lowest vacancy; sublease occupancy losses more than offset direct-space gains |
| UTC | Modest occupancy gain; one large signed lease with a future move date |
Cycle interpretation
Stabilization with mixed signals. Q3 improved the indicators of future occupancy while reversing Q2's positive net absorption. The quarter strengthens the forward pipeline, but has not yet demonstrated sustained net growth in occupied space.
Conditional sensitivity: former BD facility
A Voit property-record review reports that 318,000 SF remained recorded as occupied through Q2 and changed to vacant in Q3, despite being marketed as vacant since late 2025. Excluding that reported entry would produce a conditional net absorption result of +102,621 SF. Interpreting this as the removal of an earlier vacancy event requires confirmation that the entire space was physically vacant before July 1; that has not been independently established. The calculation does not establish actual positive net absorption. Official Q3 net absorption remains (215,379) SF.
Do not assume every landlord faces the same conditions. Compare alternatives within the submarket and size range you can actually use, then test how each owner responds on buildout, free rent and flexibility. Keep a credible second option through negotiations. Torrey Pines had the Core's lowest vacancy at 12.7%. Its (29,670) SF of Q3 net absorption reflected sublease space that became vacant; direct space recorded +30,017 SF. Lower vacancy may narrow suitable options, but neither statistic establishes the terms available for a specific space. Compare landlord offers and suitable subleases before deciding which concessions or flexibility provisions to accept.
Leasing rebounded, led by a few larger signed leases
Nineteen lease records totaled 437,771 SF, with six records of at least 20,000 SF accounting for 83.9% of the space.
Q3 2026 lease transactions · 19 deals · 437,771 SF
| Address | Submarket | Signed | SF | Tenant / record | Type |
|---|---|---|---|---|---|
| 4939 Directors Pl | Sorrento Mesa | Sep 2026 | 28,944 | Not disclosed | Direct |
| 4939 Directors Pl | Sorrento Mesa | Sep 2026 | 33,138 | Not disclosed | Direct |
| 11099 N Torrey Pines Rd | Torrey Pines | Sep 2026 | 34,336 | Avalon Bioventures | Direct |
| 6330 Nancy Ridge Dr | Sorrento Mesa | Sep 2026 | 5,045 | Not disclosed | Direct |
| 6185 Cornerstone Ct E | Sorrento Mesa | Sep 2026 | 1,174 | Not disclosed | Direct |
| 10578 Science Center Dr | Torrey Pines | Sep 2026 | 19,361 | Not disclosed | Direct |
| 11575 Sorrento Valley Rd | Sorrento Valley | Sep 2026 | 1,087 | Not disclosed | Direct |
| 11585 Sorrento Valley Rd | Sorrento Valley | Sep 2026 | 6,930 | Not disclosed | Direct |
| 9990 Mesa Rim Rd | Sorrento Mesa | Sep 2026 | 4,296 | Somatek | Direct |
| 11010 Roselle St | Sorrento Valley | Aug 2026 | 9,546 | Not disclosed | Sublease |
| 11149 N Torrey Pines Rd | Torrey Pines | Aug 2026 | 48,696 | Not disclosed | Direct |
| 6197 Cornerstone Ct E | Sorrento Mesa | Aug 2026 | 1,142 | Not disclosed | Direct |
| 6370 Nancy Ridge Dr | Sorrento Mesa | Aug 2026 | 4,955 | Not disclosed | Direct |
| 6190 Cornerstone Ct E | Sorrento Mesa | Aug 2026 | 4,522 | Not disclosed | Direct |
| 6195 Cornerstone Ct E | Sorrento Mesa | Jul 2026 | 1,210 | Not disclosed | Sublease |
| 3545 Cray Ct | Torrey Pines | Jul 2026 | 51,073 | Iambic Therapeutics | Direct |
| 5580 Morehouse Dr | Sorrento Mesa | Jul 2026 | 9,038 | Calidi Biotherapeutics | Direct |
| 9625 Towne Centre Dr | UTC | Jul 2026 | 171,001 | Capricor Therapeutics | Direct |
| 6185 Cornerstone Ct E | Sorrento Mesa | Jul 2026 | 2,277 | MileCell | Direct |
| Total | 437,771 | 19 deals |
Deals by size
| Size | Deals | Share | SF |
|---|---|---|---|
| Under 5,000 SF | 8 | 42.1% | 20,663 |
| 5,000 to under 10,000 SF | 4 | 21.1% | 30,559 |
| 10,000 to under 20,000 SF | 1 | 5.3% | 19,361 |
| 20,000 SF and above | 6 | 31.6% | 367,188 |
Leasing by submarket
| Submarket | Deals | SF | Share of SF |
|---|---|---|---|
| Sorrento Mesa | 11 | 95,741 | 21.9% |
| Sorrento Valley | 3 | 17,563 | 4.0% |
| Torrey Pines | 4 | 153,466 | 35.1% |
| UTC | 1 | 171,001 | 39.1% |
Interpretation: signed leasing vs. occupancy
The 437,771 SF signed in Q3 forms a meaningful forward occupancy pipeline, up 140.9% from Q2 but down 25.5% from Q3 2025. Recorded move dates place 95.6% of that space after quarter-end. Capricor's 171,001 SF lease lists January 2027; two Directors Place records totaling 62,082 SF list October 2028. Five records list move dates within Q3.
Signed leases are a strong indicator of future occupancy. Their net absorption impact depends on commencement timing, expansion versus relocation or consolidation, and space released elsewhere in the Core. Tenant names are unavailable for 13 of the 19 records shown, and prior footprints and space releases are not fully known. Signed square footage therefore cannot be treated as an equal amount of future positive net absorption.
Ask when a space can be delivered in the condition your team needs, and separate that date from signing and rent commencement. Longer-dated signed leases can remove choices before tenants move in. Keep alternatives under review, verify any remaining availability directly, and negotiate responsibility for fit-out delays. The lease should connect payment obligations to the delivery milestones that matter to your operations.
Capital is flowing selectively; its contribution to additional space demand is not yet established
Within the San Diego County life-science ecosystem, more venture rounds and two completed IPOs support selected companies without establishing broader space-demand growth.
Capital and company activity cover the San Diego County life-science ecosystem. Real-estate fundamentals elsewhere in this report cover the four-submarket Voit Core Cluster.
A · Venture funding: $391.55M across 16 companies
Venture funding fell 37.3% from Q2 and 52.9% from Q3 2025, despite an increase from 10 to 16 rounds. The three largest rounds accounted for 58.7% of disclosed proceeds, led by Crystalys at $130M. More companies raised capital, but the lower total and concentration of proceeds indicate selective access.
Top 10 Q3 2026 venture rounds
| # | Company | Amount | Stage |
|---|---|---|---|
| 1 | Crystalys Therapeutics | $130.00M | Growth |
| 2 | Khartis Therapeutics | $50.00M | Growth |
| 3 | Caspian Therapeutics | $50.00M | Series A |
| 4 | Prana Therapies | $40.23M | Growth |
| 5 | Inocras | $31.00M | Growth |
| 6 | Mindera Health | $30.44M | Growth |
| 7 | Amplifica Holdings | $26.00M | Growth |
| 8 | CeleCor Therapeutics | $11.86M | Growth |
| 9 | AlzPath | $8.41M | Seed |
| 10 | BTB Therapeutics | $5.50M | Series A |
Q3 dollars by recorded stage
Rounds classified as Growth received 82.1% of disclosed venture funding. Stage classifications follow Connect San Diego; Growth does not necessarily indicate a late clinical stage.
B · M&A and exits: transaction value, not new capital
| Transaction | Q3 lifecycle | Value / financing distinction |
|---|---|---|
| Vertex / Crinetics | Announced July 6; closed September 1 | Approximately $10.0B acquisition value; one transaction |
| Werewolf / Ambros | Announced August 21; pending | Separate $150M PIPE pending with merger |
| Skye / Redx | Announced August 17; pending | $125M associated financing reported; transaction value undisclosed |
BlossomHill $168.30M · August 2026
Combined $614.55M · Q3 2026
BlossomHill includes its Q3 partial option exercise. ADARx excludes the October 1 option exercise. IPO proceeds are separate from venture funding. These offerings demonstrate public-market access for selected companies. They do not establish a broad reopening or associated Q3 facility expansion.
Size a commitment around the laboratory program your funded plan can support, and identify what would trigger additional space. Treat financing as a reason to reassess runway and flexibility, rather than an automatic expansion signal. Compare the cost of taking extra space now with a negotiated expansion option. Track the time needed for permitting, fit-out and commissioning before setting a target move date.
Existing space defines the near-term choice set
Limited active construction does not yet mean scarce tenant options across the Core Cluster. The Core has 6.41M SF of reported availability; practical choices depend on lab suitability, contiguous space and delivery readiness.
Prior reports associate the remaining construction with a precommitted Novartis project. Its current delivery schedule and the timing of new space available to other tenants have not been confirmed. With 6.41M SF already reported available, the immediate question is how well existing buildings meet tenant requirements and how quickly that space is absorbed.
Larger requirements depend on contiguous, suitable space
The Core contains 6.41M SF of reported availability, including 3.31M SF of direct availability in Sorrento Mesa. These totals establish substantial marketed space, but not the number of contiguous blocks a tenant can use. A large requirement still needs verification of remaining area, laboratory condition and delivery date. Q3 signed leases can change the choices before recorded move dates occur. Sorrento Mesa contains the most direct availability; Torrey Pines retains 444,368 SF of sublease competition despite having the Core's lowest vacancy.
Market segmentation by availability size · Q3 2026
| Availability size | <1,000 SF | 1,001–5,000 | 5,001–10,000 | 10,001–20,000 | 20,001–50,000 | 50,001+ |
|---|---|---|---|---|---|---|
| No. properties | 4 | 33 | 48 | 67 | 81 | 35 |
| No. available spaces | 35 | 70 | 70 | 119 | 165 | 104 |
Context · major U.S. life-science clusters, Q2 2026
| CBRE-defined market | Total vacancy | Under construction |
|---|---|---|
| Boston-Cambridge | 28.7% | 2,109,000 SF |
| San Francisco Bay Area | 31.1% | 138,500 SF |
| San Diego, CBRE-defined | 26.3% | 466,598 SF |
Market-wide slack remains substantial; opportunity depends on fit, timing and operating needs
Three forces explain how stronger forward leasing signals, substantial tenant choice and selective company activity can coexist.
Stabilization signals have strengthened; sustained recovery remains unconfirmed
Stronger quarterly signed leasing and lower marketed availability support stabilization, while negative net absorption shows that those forward signals have not yet produced sustained market-wide occupancy growth.
- 437,771 SF signed in Q3, +140.9% QoQ; 95.6% carries move dates after Q3
- (215,379) SF Q3 net absorption
- 28.1% vacancy, up from 27.1%
- (234,089) SF change in marketed availability
Suitable space can be leased before a broad recovery appears in vacancy or net absorption. Stronger signings are constructive, but they do not yet establish sustained market-wide tightening.
Substantial tenant choice does not translate into uniform negotiating leverage
Existing inventory provides extensive near-term choice, but the alternatives a tenant can actually use depend on submarket, technical suitability, contiguous size, readiness and delivery timing.
- 41.4% Sorrento Mesa vacancy vs. 12.7% Torrey Pines (~28.7 pts spread)
- 6.41M SF reported availability
- Torrey Pines retains 444,368 SF of sublease space
- 0 SF delivered Q1–Q3 2026; 466,592 SF under construction is precommitted
Leverage comes from executable alternatives and actual competing offers, not the Core vacancy rate alone. High aggregate availability does not give every requirement the same choices or negotiating position.
Capital supports selected companies; footprint growth depends on operating needs
Financing and corporate activity can support programs and reshape companies, but additional local space demand depends on funded operating requirements, existing capacity, outsourcing and integration decisions.
- $391.55M County VC across 16 companies; down 37.3% QoQ; top three rounds 58.7% of disclosed funding
- $614.55M gross from two completed IPOs, separate from VC
- ~$10B Vertex / Crinetics; facility outcome unknown
Capital creates potential demand, but footprint decisions should follow funded programs, required capacity and the company's operating plan.
San Diego still offers substantial tenant choice, but the decisions that matter are specific to the requirement: which spaces are actually usable, when they can be delivered, and whether the company's operating plan supports the commitment. The practical advantage comes from testing credible alternatives early and structuring the lease around the company's actual milestones.
Structure the lease around your milestones and cash needs
Q3 leaves substantial tenant choice, with negotiating strength determined by the space, the owner and the commitment you can make.
Concession reference points for Q3 negotiations
Lease structuring considerations
Early Termination Option
Request a one-time termination option around month 18 or 24 if that aligns with a financing or regulatory decision. Evaluate the termination fee, notice period and any required repayment of concessions before assessing the option's value. Compare the total cost with a shorter initial term.
Expansion Through Lease Replacement
When expanding within a project, ask for a replacement lease covering the combined footprint. A single expiration and delivery plan can simplify operations. Reopen the concession discussion, then compare the combined cost and remaining obligations with an expansion amendment or a move.
Milestone-Based Security Deposit Reductions
Propose staged reductions tied to clearly defined funding or payment milestones. Specify the amount released, timing, documentation and conditions. Prior examples cited reductions of 25%–50%; these are negotiating reference points, not established Q3 market terms. Assess whether the release schedule returns cash when the operating plan requires it.
Letter of Credit as Lease Security
Compare a letter of credit with a cash deposit using the bank's actual fees and collateral requirements. A letter of credit preserves operating liquidity only to the extent that required cash collateral is lower than the cash deposit it replaces. Negotiate draw conditions, expiration, renewal and reductions together, then compare total cost and accessible cash under both structures.
Negotiating considerations by submarket
| Submarket | Q3 evidence | Negotiating approach |
|---|---|---|
| Sorrento Mesa | 41.4% vacancy; negative net absorption | Compare total occupancy costs and flexibility across suitable available spaces. |
| Sorrento Valley | 31.6% vacancy; reported occupied space increased | Compare available spaces and offered terms in light of Q3 occupancy gains. |
| UTC | 22.3% vacancy; modest reported occupancy gain | Compare delivery condition, tenant-funded buildout and lease term across suitable alternatives. |
| Torrey Pines | 12.7% vacancy; sublease occupancy losses more than offset direct-space gains | Evaluate technical fit, expansion rights and suitable sublease alternatives. |
Negotiate lease economics and flexibility against actual landlord and sublandlord offers for currently available comparable spaces. Match the lease term, security requirements and expansion commitments to business milestones, and retain a workable alternative. Q3 supports a competitive search, but does not establish that every concession or structure will be available. Commit when suitable space, delivery timing and total occupancy cost support the operating plan.
Base case: stabilization, with net absorption the next test
Scheduled occupancy will test whether stronger signed leasing produces net gains after relocations, consolidations and prior-space givebacks.
Stabilization with mixed signals. The base case is an uneven adjustment across existing buildings, with continued tenant choice. Q3 signed leases provide a strong forward occupancy indicator, but a stronger recovery assessment requires sustained positive net absorption after relocations, consolidations and prior-space releases. Repeated occupancy losses, rising vacancy and renewed growth in marketed availability would weaken the stabilization case.
Supporting evidence
- Signed leasing rose 140.9% QoQ; excluding Capricor, volume still exceeded Q2's entire total by 46.8%.
- Reported available SF fell 234,089; sublease availability fell 47,338 SF QoQ.
- No deliveries occurred in Q1–Q3; one 466,592 SF building remains under construction.
- Positive Q2 net absorption remains valid in CoStar's updated historical figures, providing evidence of an earlier improvement that Q3 did not repeat.
Risks and counterevidence
- Q3 net absorption was (215,379) SF; vacancy rose to 28.1%; year-to-date net absorption was (197,224) SF.
- Only two submarkets gained occupancy. Leasing is below Q3 2025 and concentrated in a few records.
- Most signed SF is scheduled beyond Q3; the net benefit depends on relocation, expansion and the timing of prior-space givebacks.
- County VC dollars declined; research-funding timing and acquisition integration could affect future requirements.
- Comparable Q3 evidence does not establish a market-wide change in concessions or effective occupancy costs; current workforce evidence is also incomplete.
Conditions that would change the outlook
| Indicator | Q3 position | What would change the assessment |
|---|---|---|
| Sustained occupancy growth | (215,379) SF net absorption; 28.1% vacancy | Two consecutive future quarters of positive net absorption with falling vacancy would strengthen the recovery case. Repeated losses and rising marketed availability would weaken stabilization. |
| Breadth of occupancy gains | Two of four submarkets recorded positive net absorption | Positive net absorption in at least three submarkets for two consecutive future quarters would indicate a broader improvement. |
| Net impact of Q3 lease commitments | 418,641 SF carries recorded move dates after Q3 | Scheduled occupancy in Q4 and 205,337 SF scheduled for 2027 would strengthen demand if gains exceed associated prior-space releases. Delays or offsetting releases would reduce the net benefit. |
| Marketed and sublease availability | 6,408,740 SF total; 1,179,638 SF sublease | Sustained declines would reduce marketed supply; repeated increases would indicate renewed pressure. |
| Capital translating into space | County VC of $391.55M across 16 companies | Verified additional space requirements, expansion leases and net occupancy gains among funded companies would support a 2027–2028 demand contribution. |
| Negotiated lease economics | No comparable Q3 series | Consistent changes in free rent, buildout contributions and total occupancy cost across comparable offers and executed leases would indicate changing negotiating conditions. |
Build a footprint plan that works if the market improves gradually or remains soft. Secure space for committed programs and negotiate options for uncertain growth. Align funding milestones, lease notices and buildout decisions. Reassess the plan when operating requirements, market occupancy or actual landlord and sublandlord offers for comparable available spaces change. A single quarterly headline is not sufficient reason to accelerate a long-term commitment.